
Measuring Center
Chapter 1 - Day 9 - Lesson 1.6
Chapter 1
Day 1
Day 2
Day 3
Day 4
Day 5
Day 6
Day 7
Day 8
Day 9
Day 10
Day 11
Day 12
Day 13
Day 14
Day 15
Day 16
Day 17
Day 18
All Chapters
Learning Targets
-
Find and interpret the median of a distribution of quantitative data.
-
Calculate the mean of a distribution of quantitative data.
-
Compare the mean and median of a distribution, and choose the more appropriate measure of center in a given setting.
Activity: How Many Hours Do You Work? Part 2
Activity:


Answer Key:
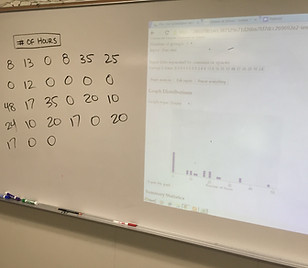
Show students the picture of the data that we collected back in Lesson 1.3. This data set is ideal for this lesson because it will typically be skewed to the right and can provoke some good discussion about mean vs. median as a measure of center.
Most students remembered how to find mean and median from middle school. Be sure that students know how to interpret a mean (average) and a median (about half of the values are less and half are more) in a context. Students should also recognize that the added outlier of 65 hours will increase the mean (not resistant) much more than the median (resistant). Therefore, the median is a better measure of center here.
Notes
Most students learn mean, median, and mode together in middle school. They often want to say that all three are measures of center. This is not necessarily the case. The mode could be near the center of the distribution but could certainly be anywhere else in the distribution. Thus, mode is not really a measure of center.
This section is the first time that students are introduced to xbar. This is very important and will be used throughout the text. Xbar is a mean calculated from a sample. Later, we will use the Greek symbol mu to represent a mean calculated from a population.
The interpretation of the z-score will become very important in later lessons. For each of our classes, we chose a single student to be in charge of the z-score interpretation. Now, every time we calculate a z-score in class, we will ask that person for the correct interpretation. This will pay off later.